Appearance
Report Dashboard
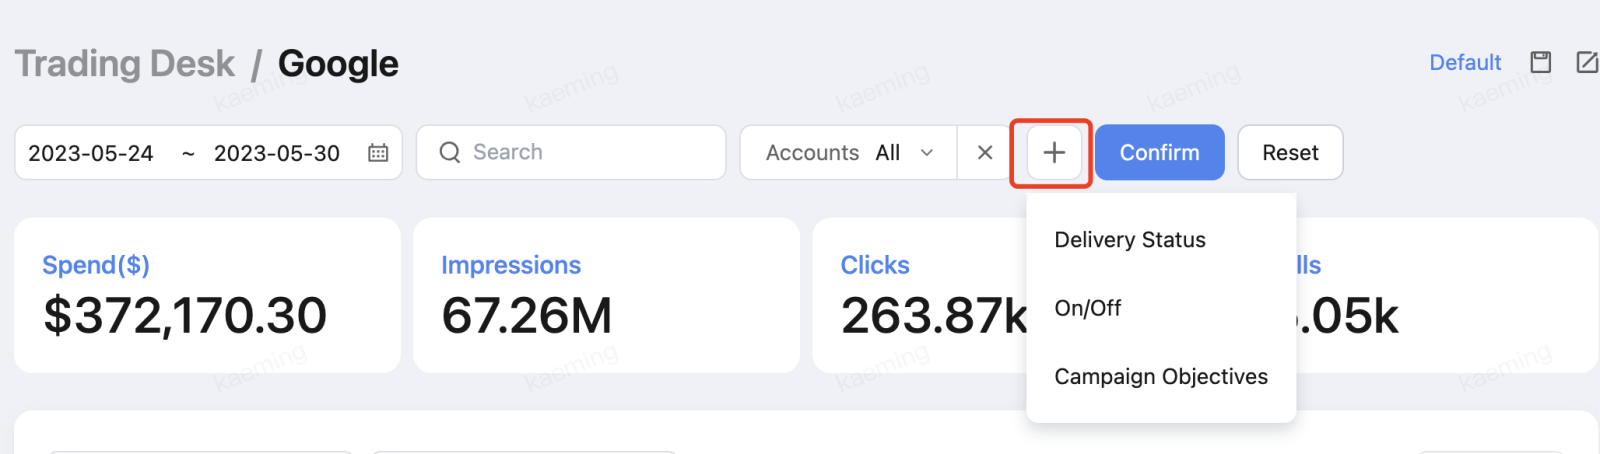
Filter Data
To filter data, click the + (plus) button and select the filtering conditions.
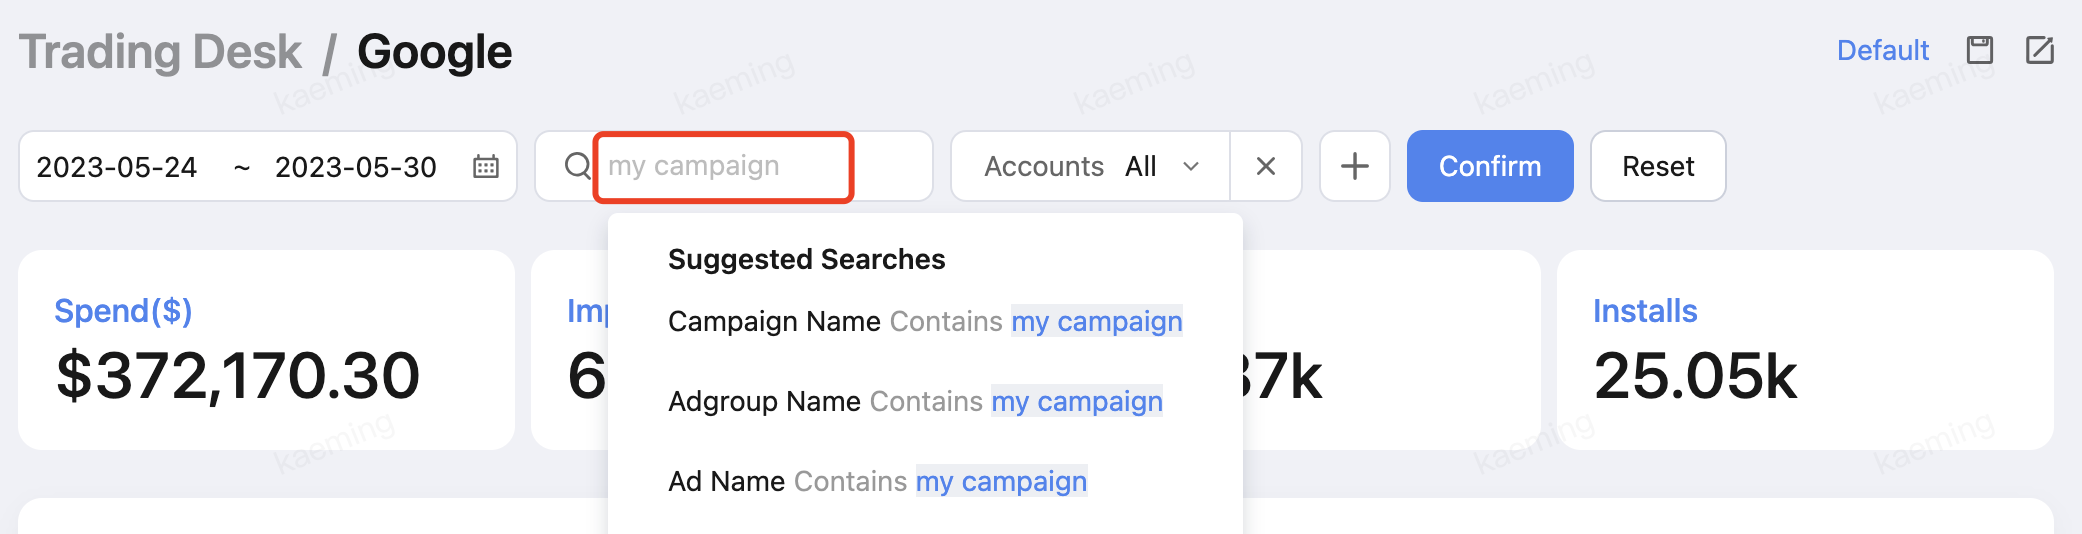
You can also enter keywords in the search box to retrieve data that includes the search terms in Campaign, Adgroup, or Ad names.
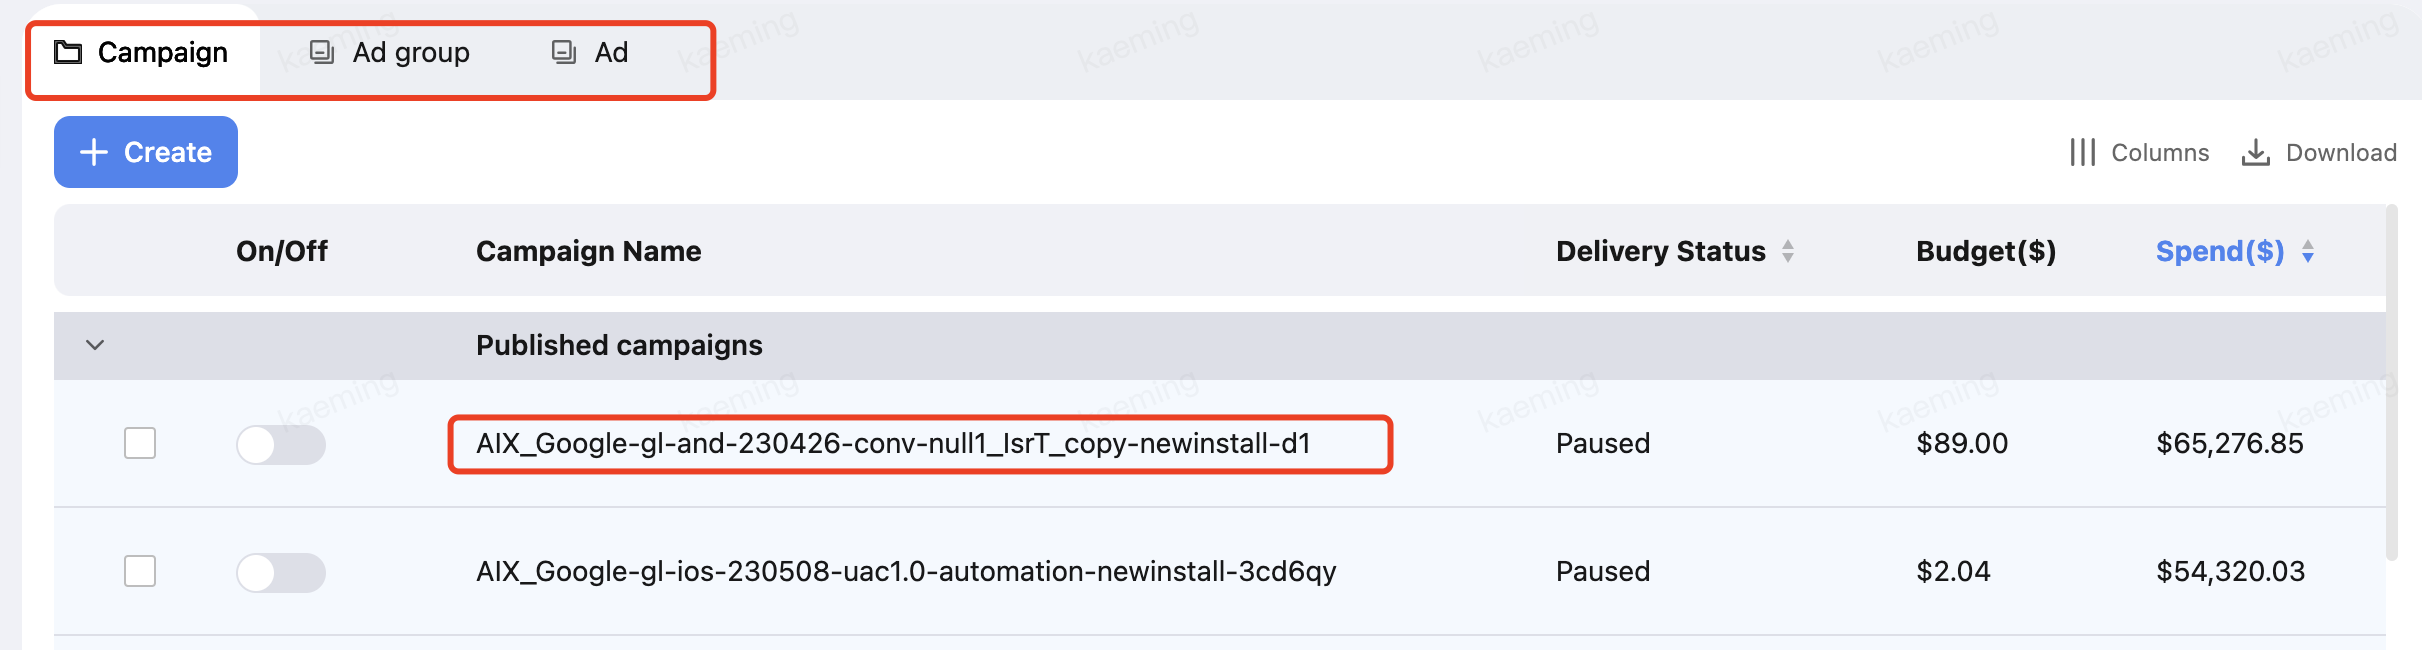
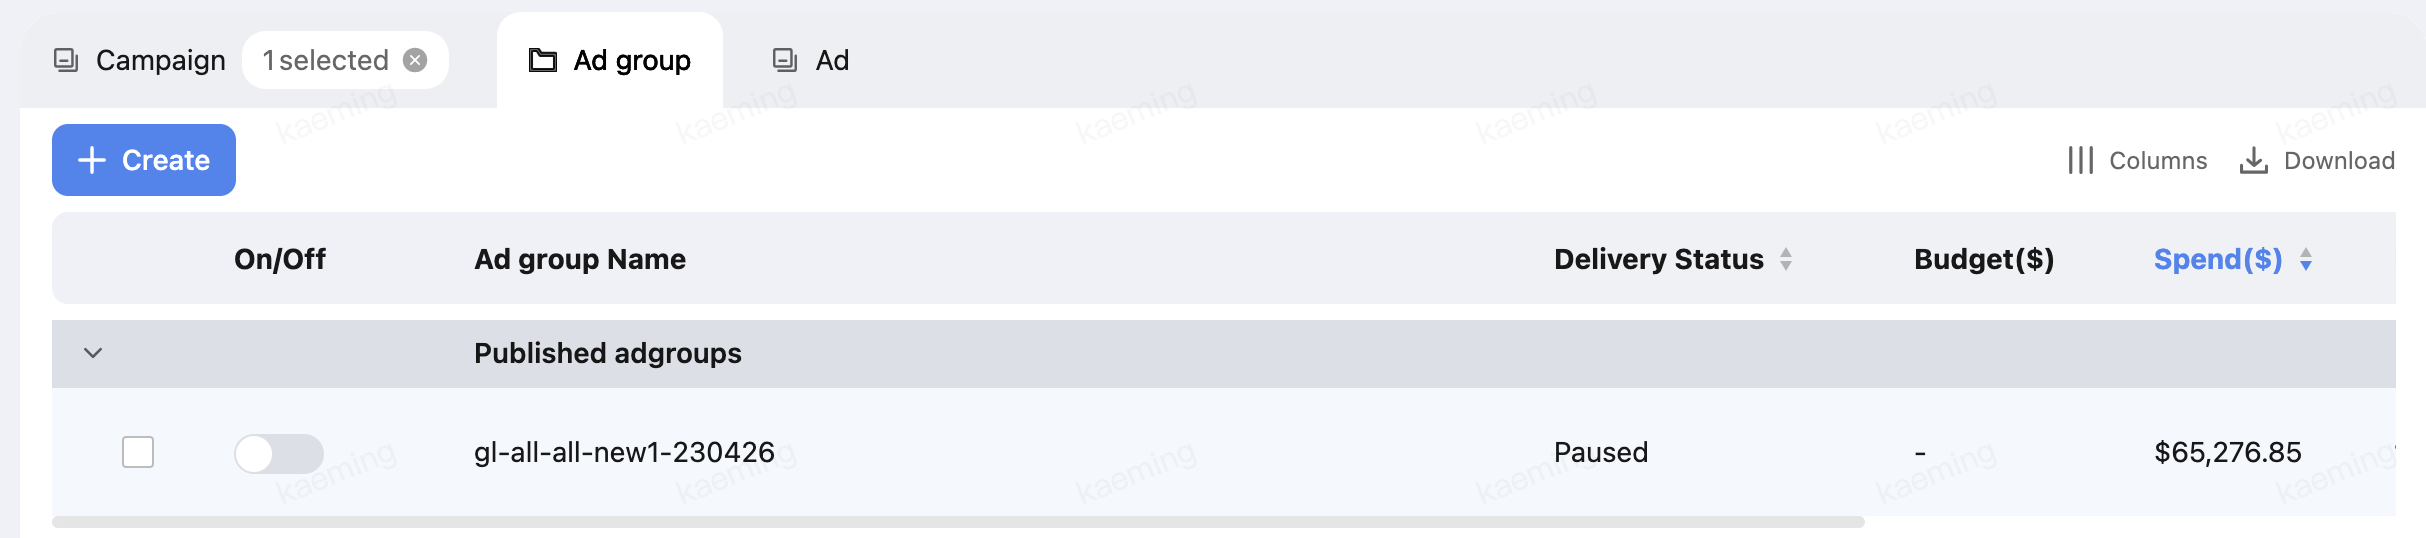
To switch layers, click the name or the layer tab.
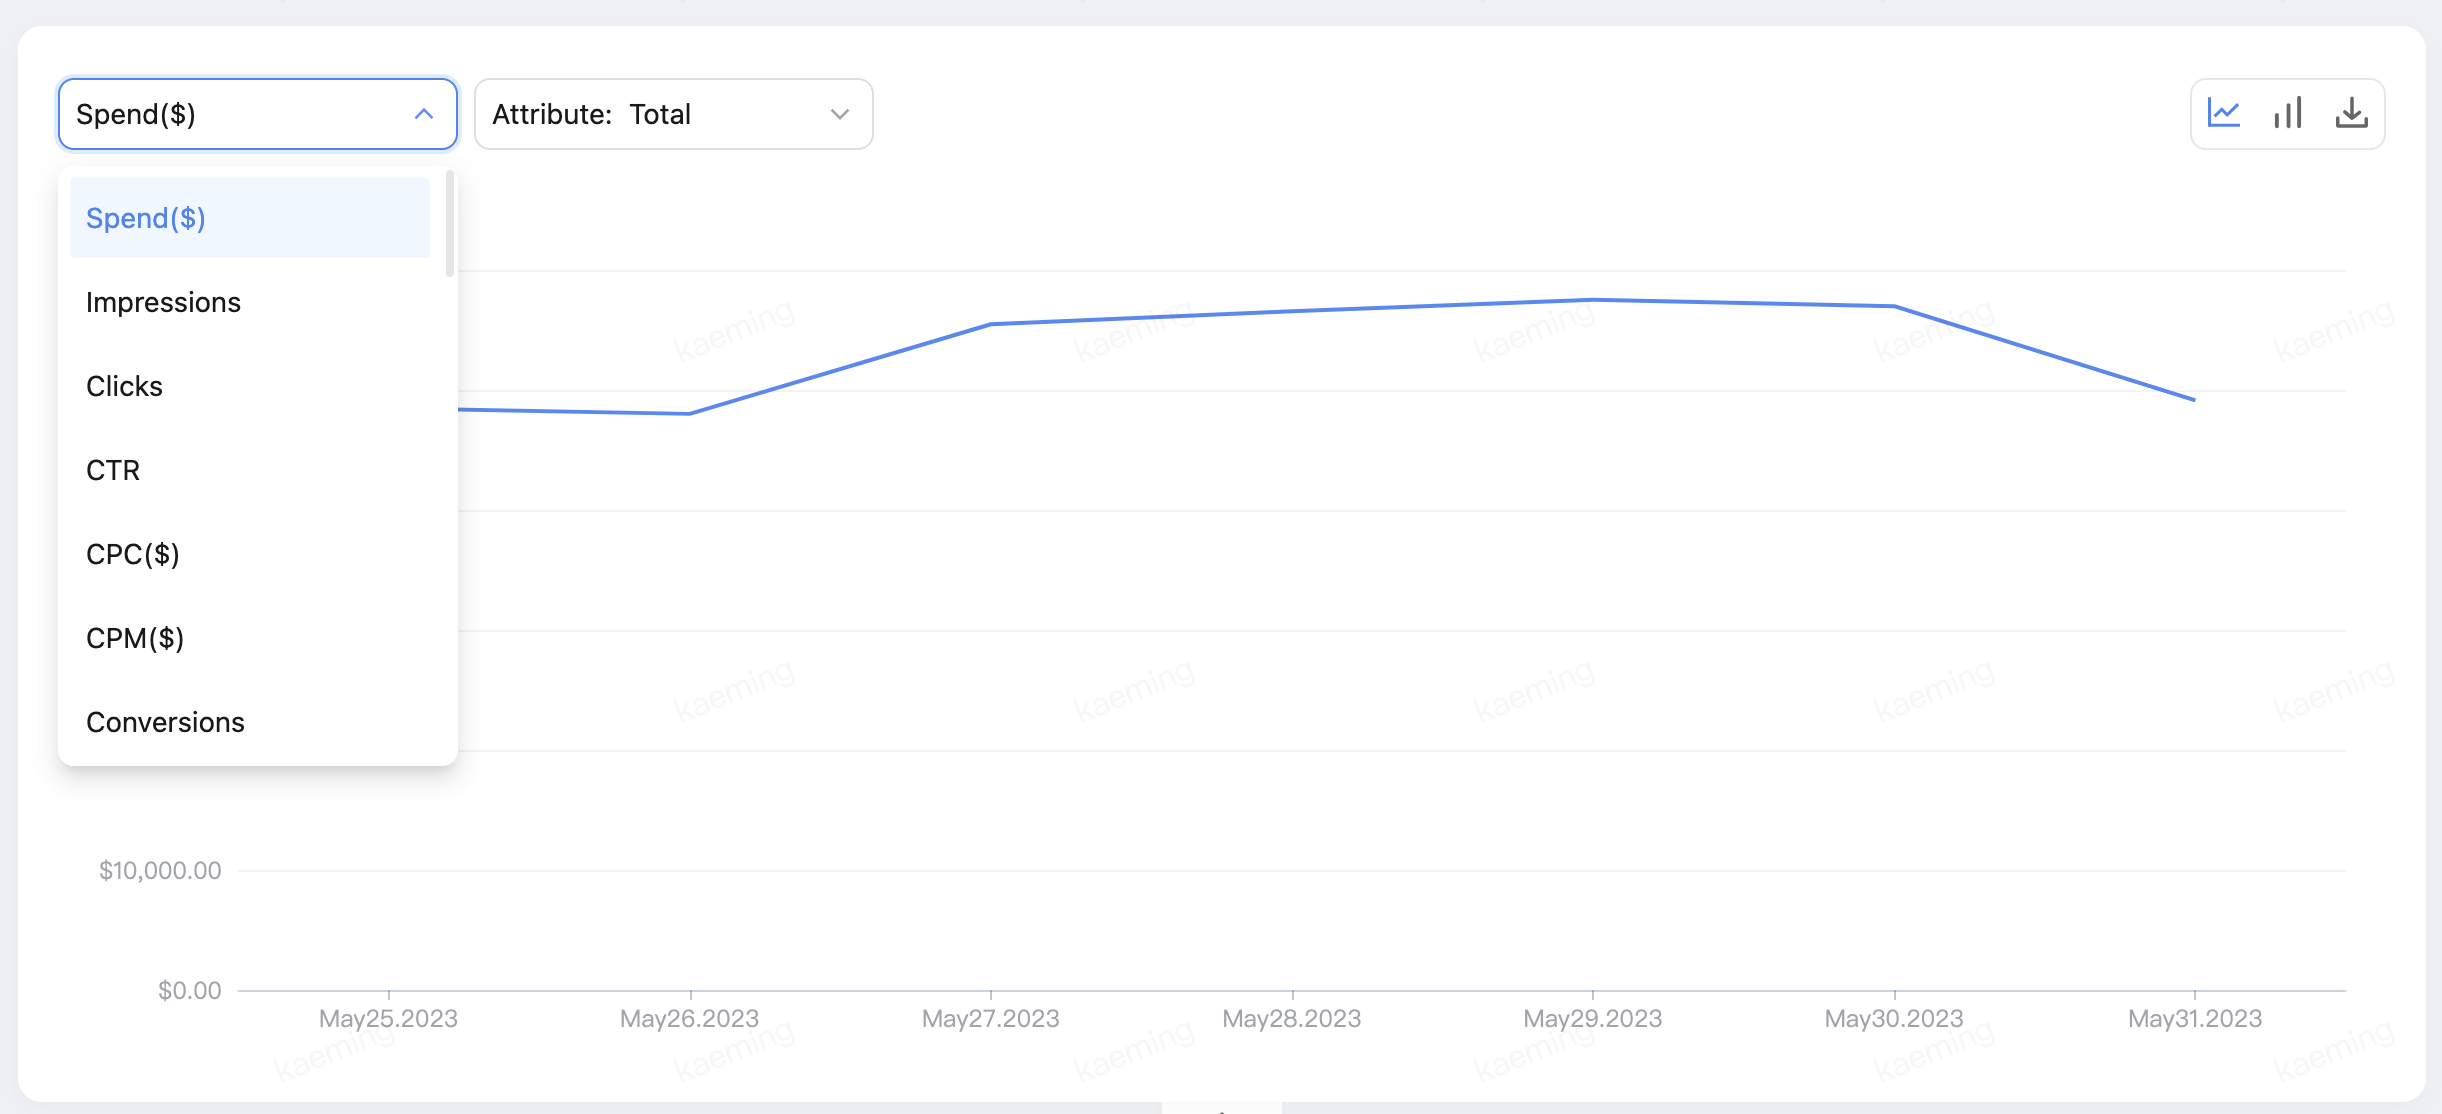
Analyze Trends
In the upper left corner of the data trend chart, filter the level and metrics you wish to observe.
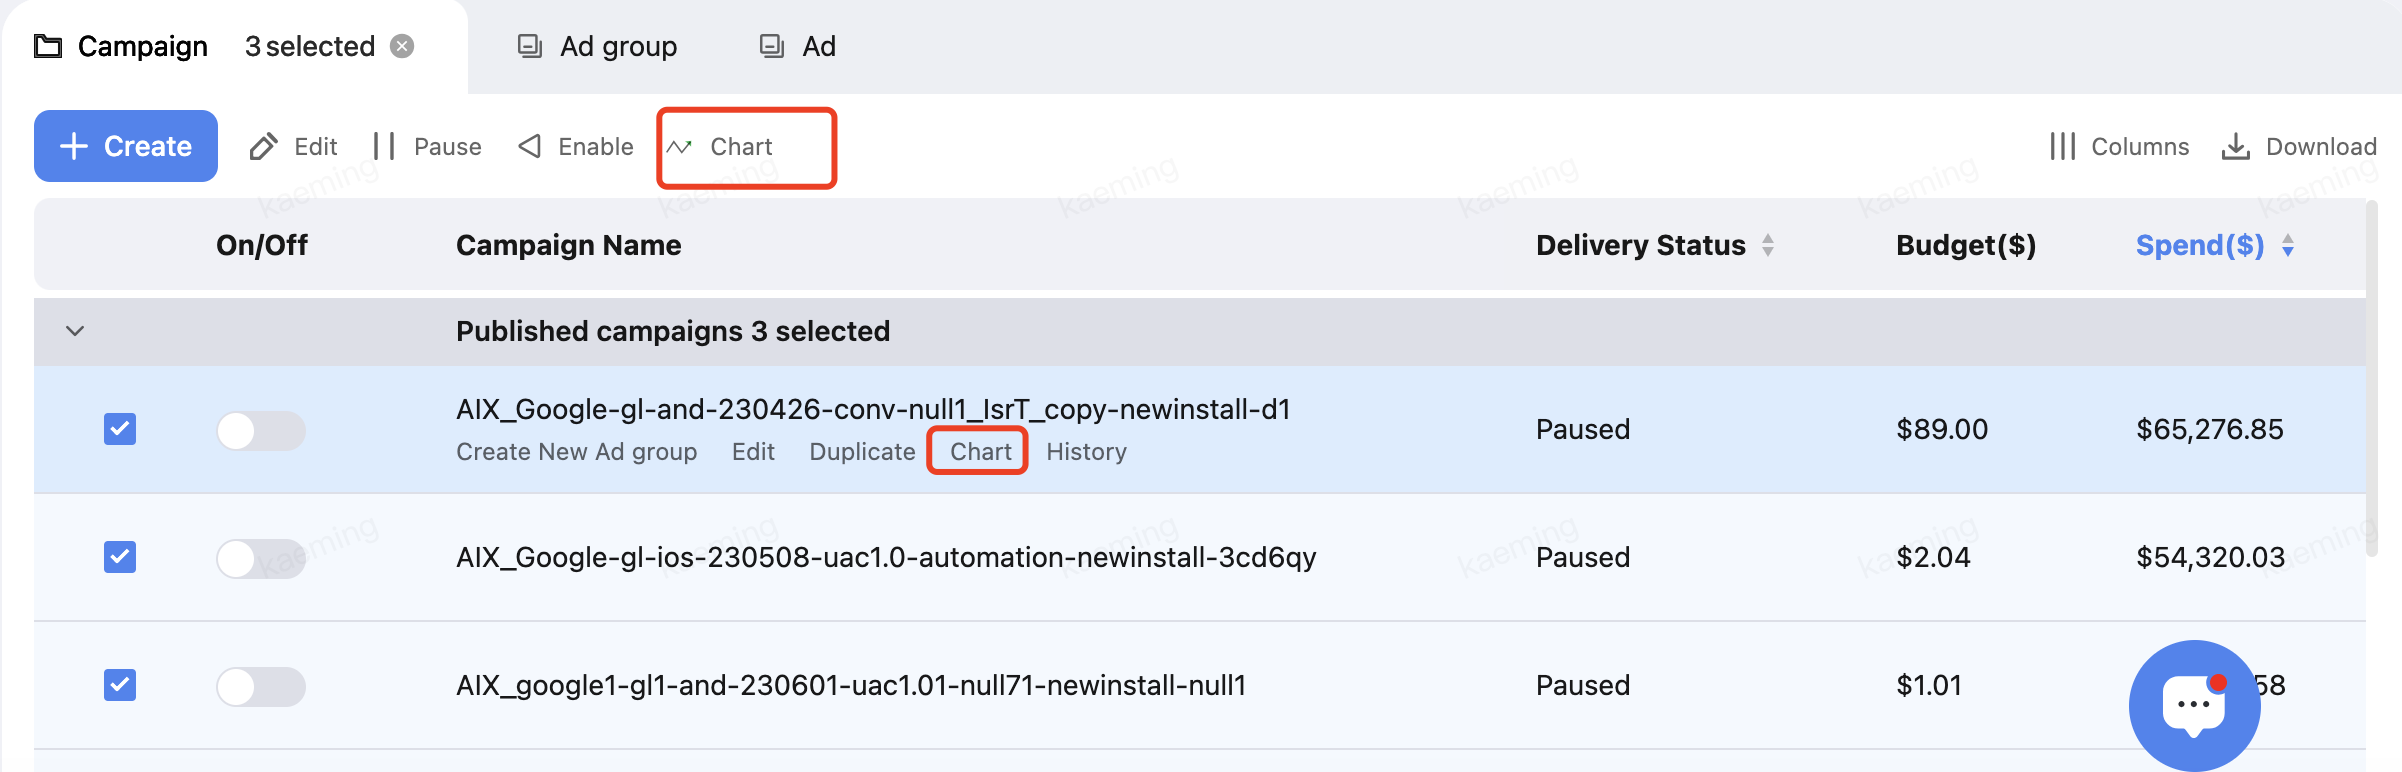
Select specific objects in the data table and click Chart to view their data trends.
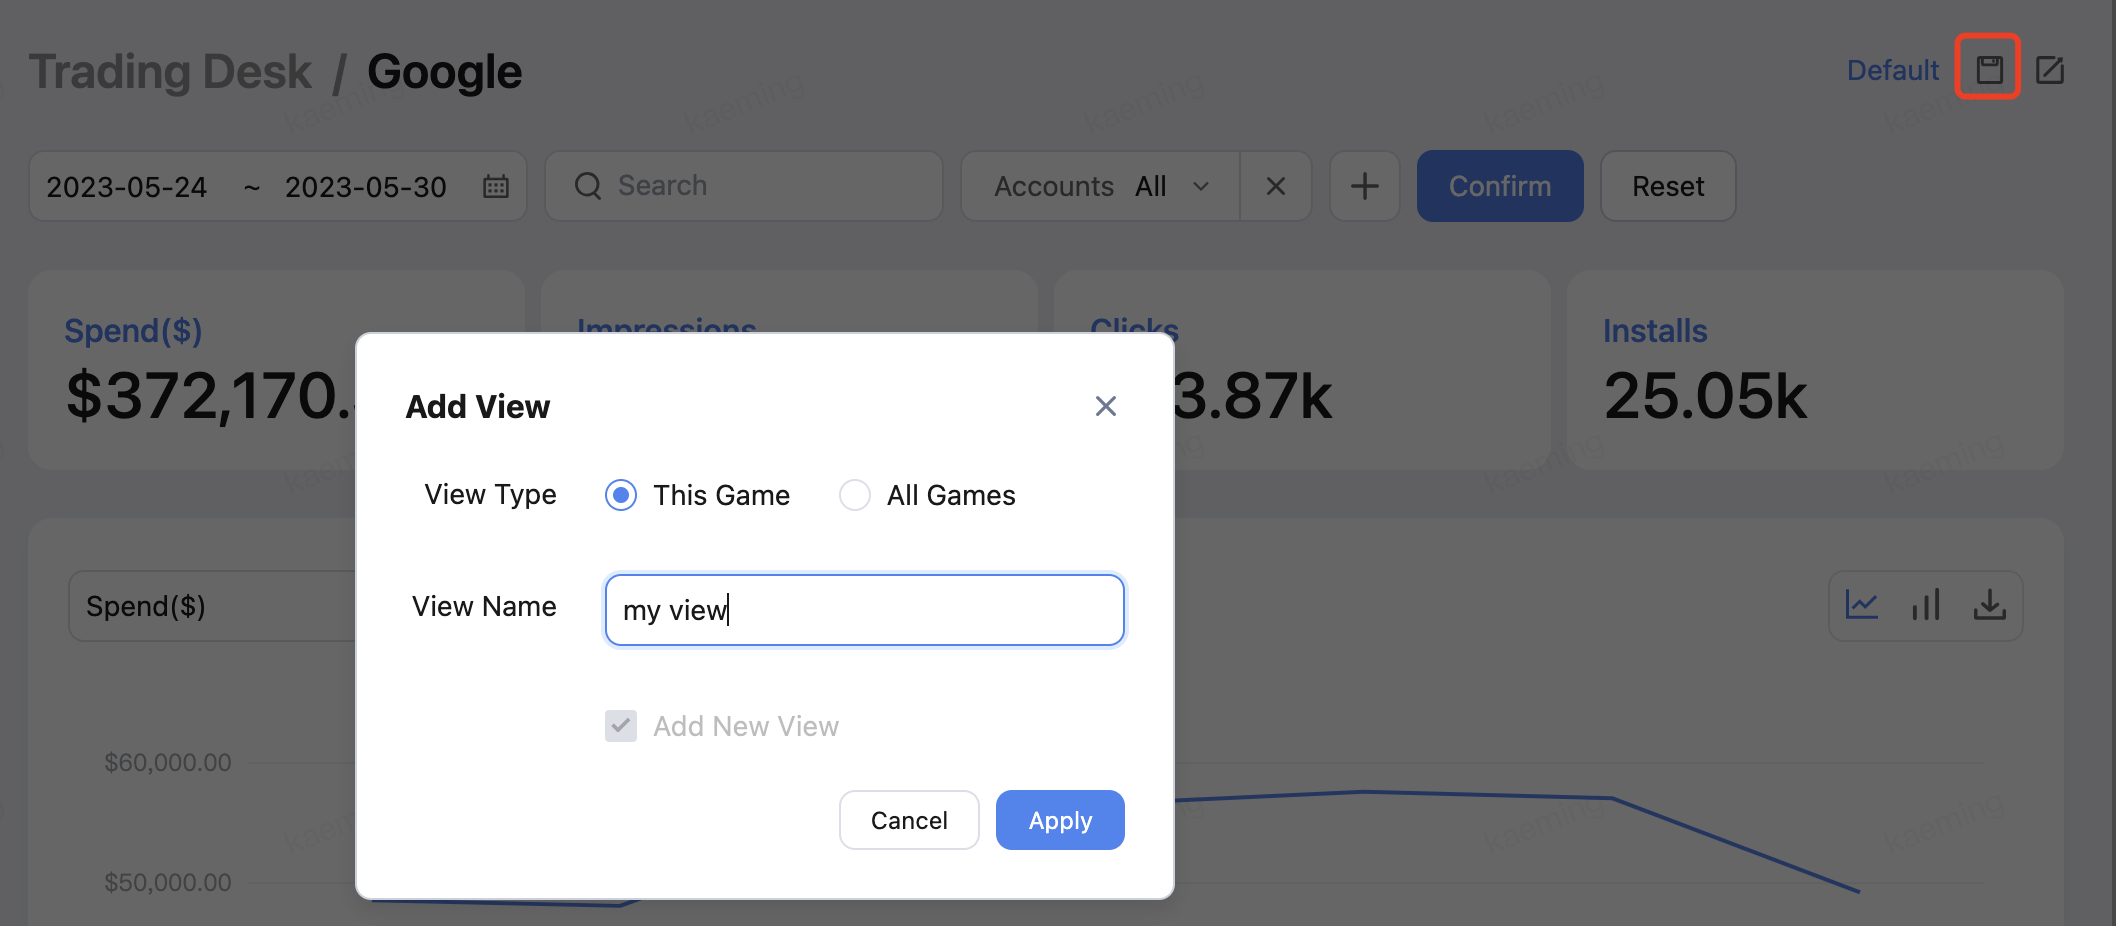
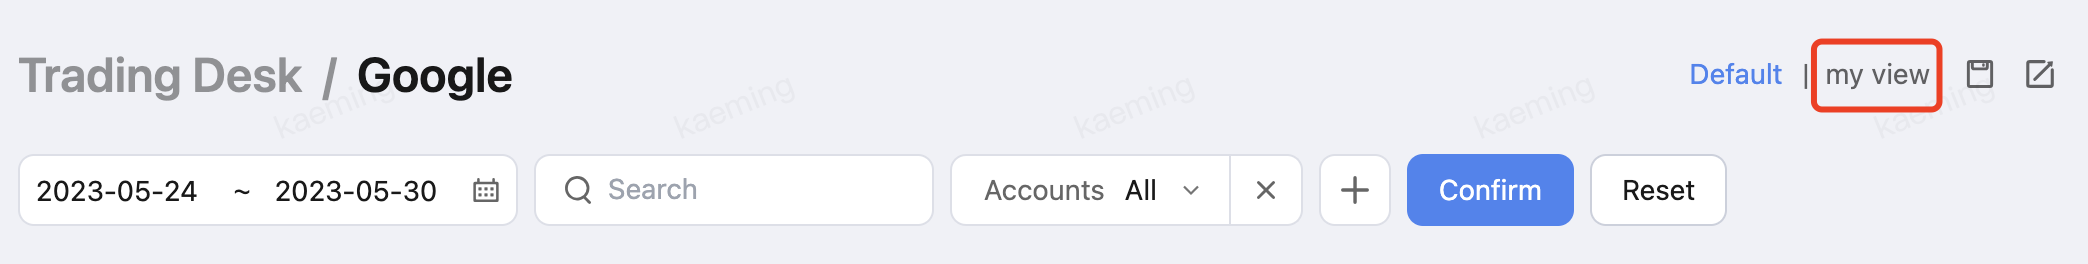
Save Views
To save filtering conditions for easy access next time, click Save in the upper right corner.
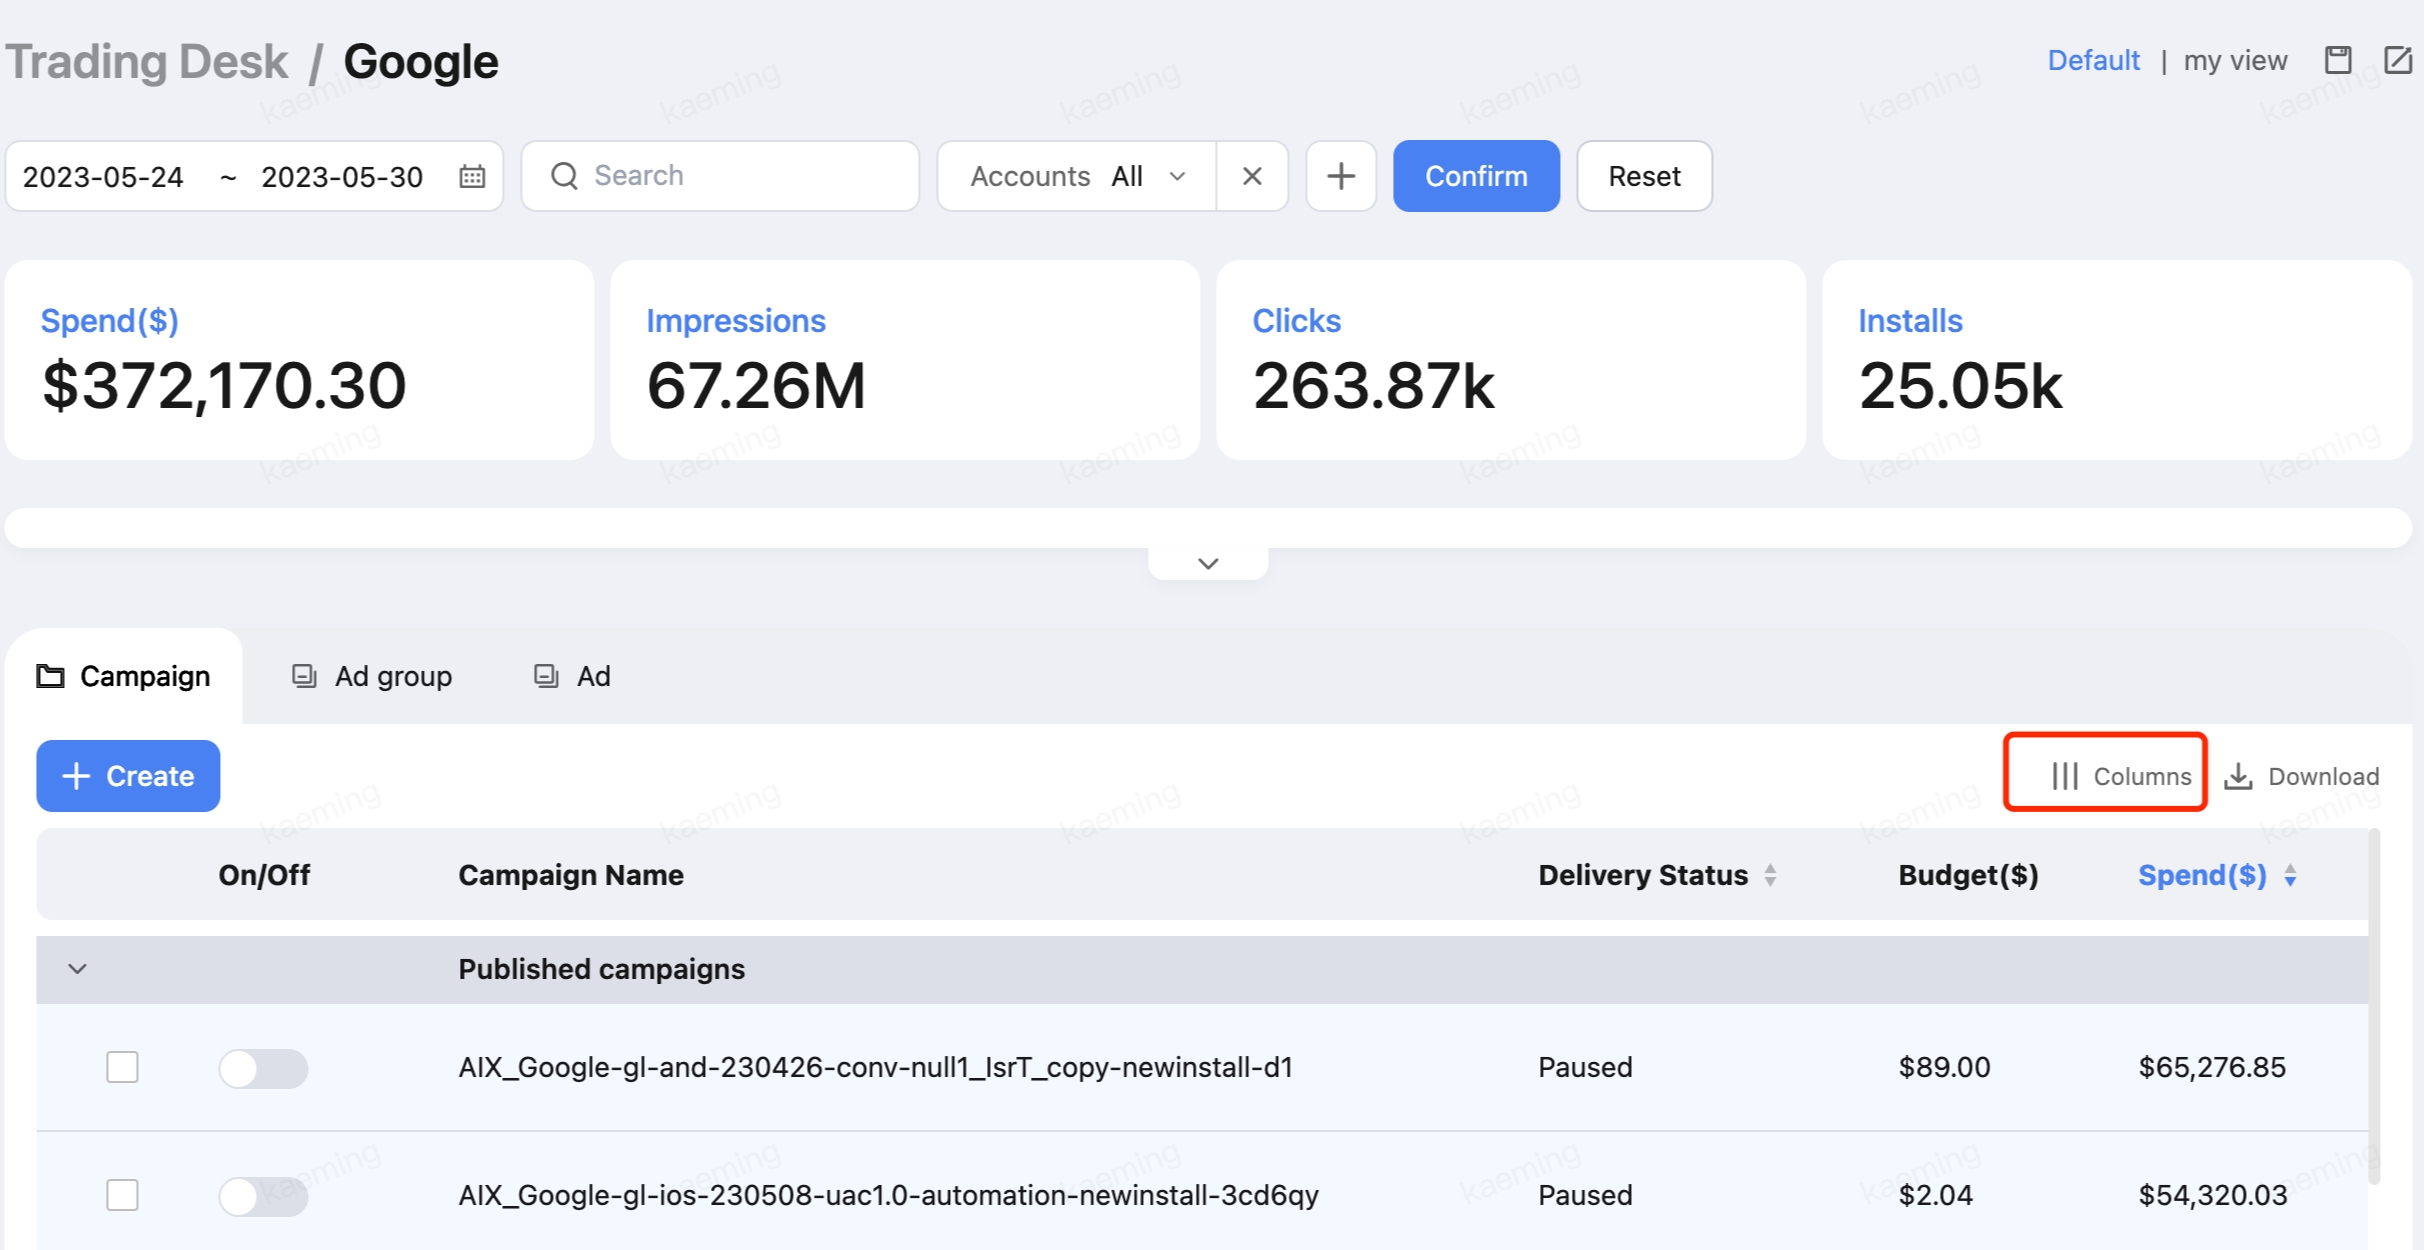
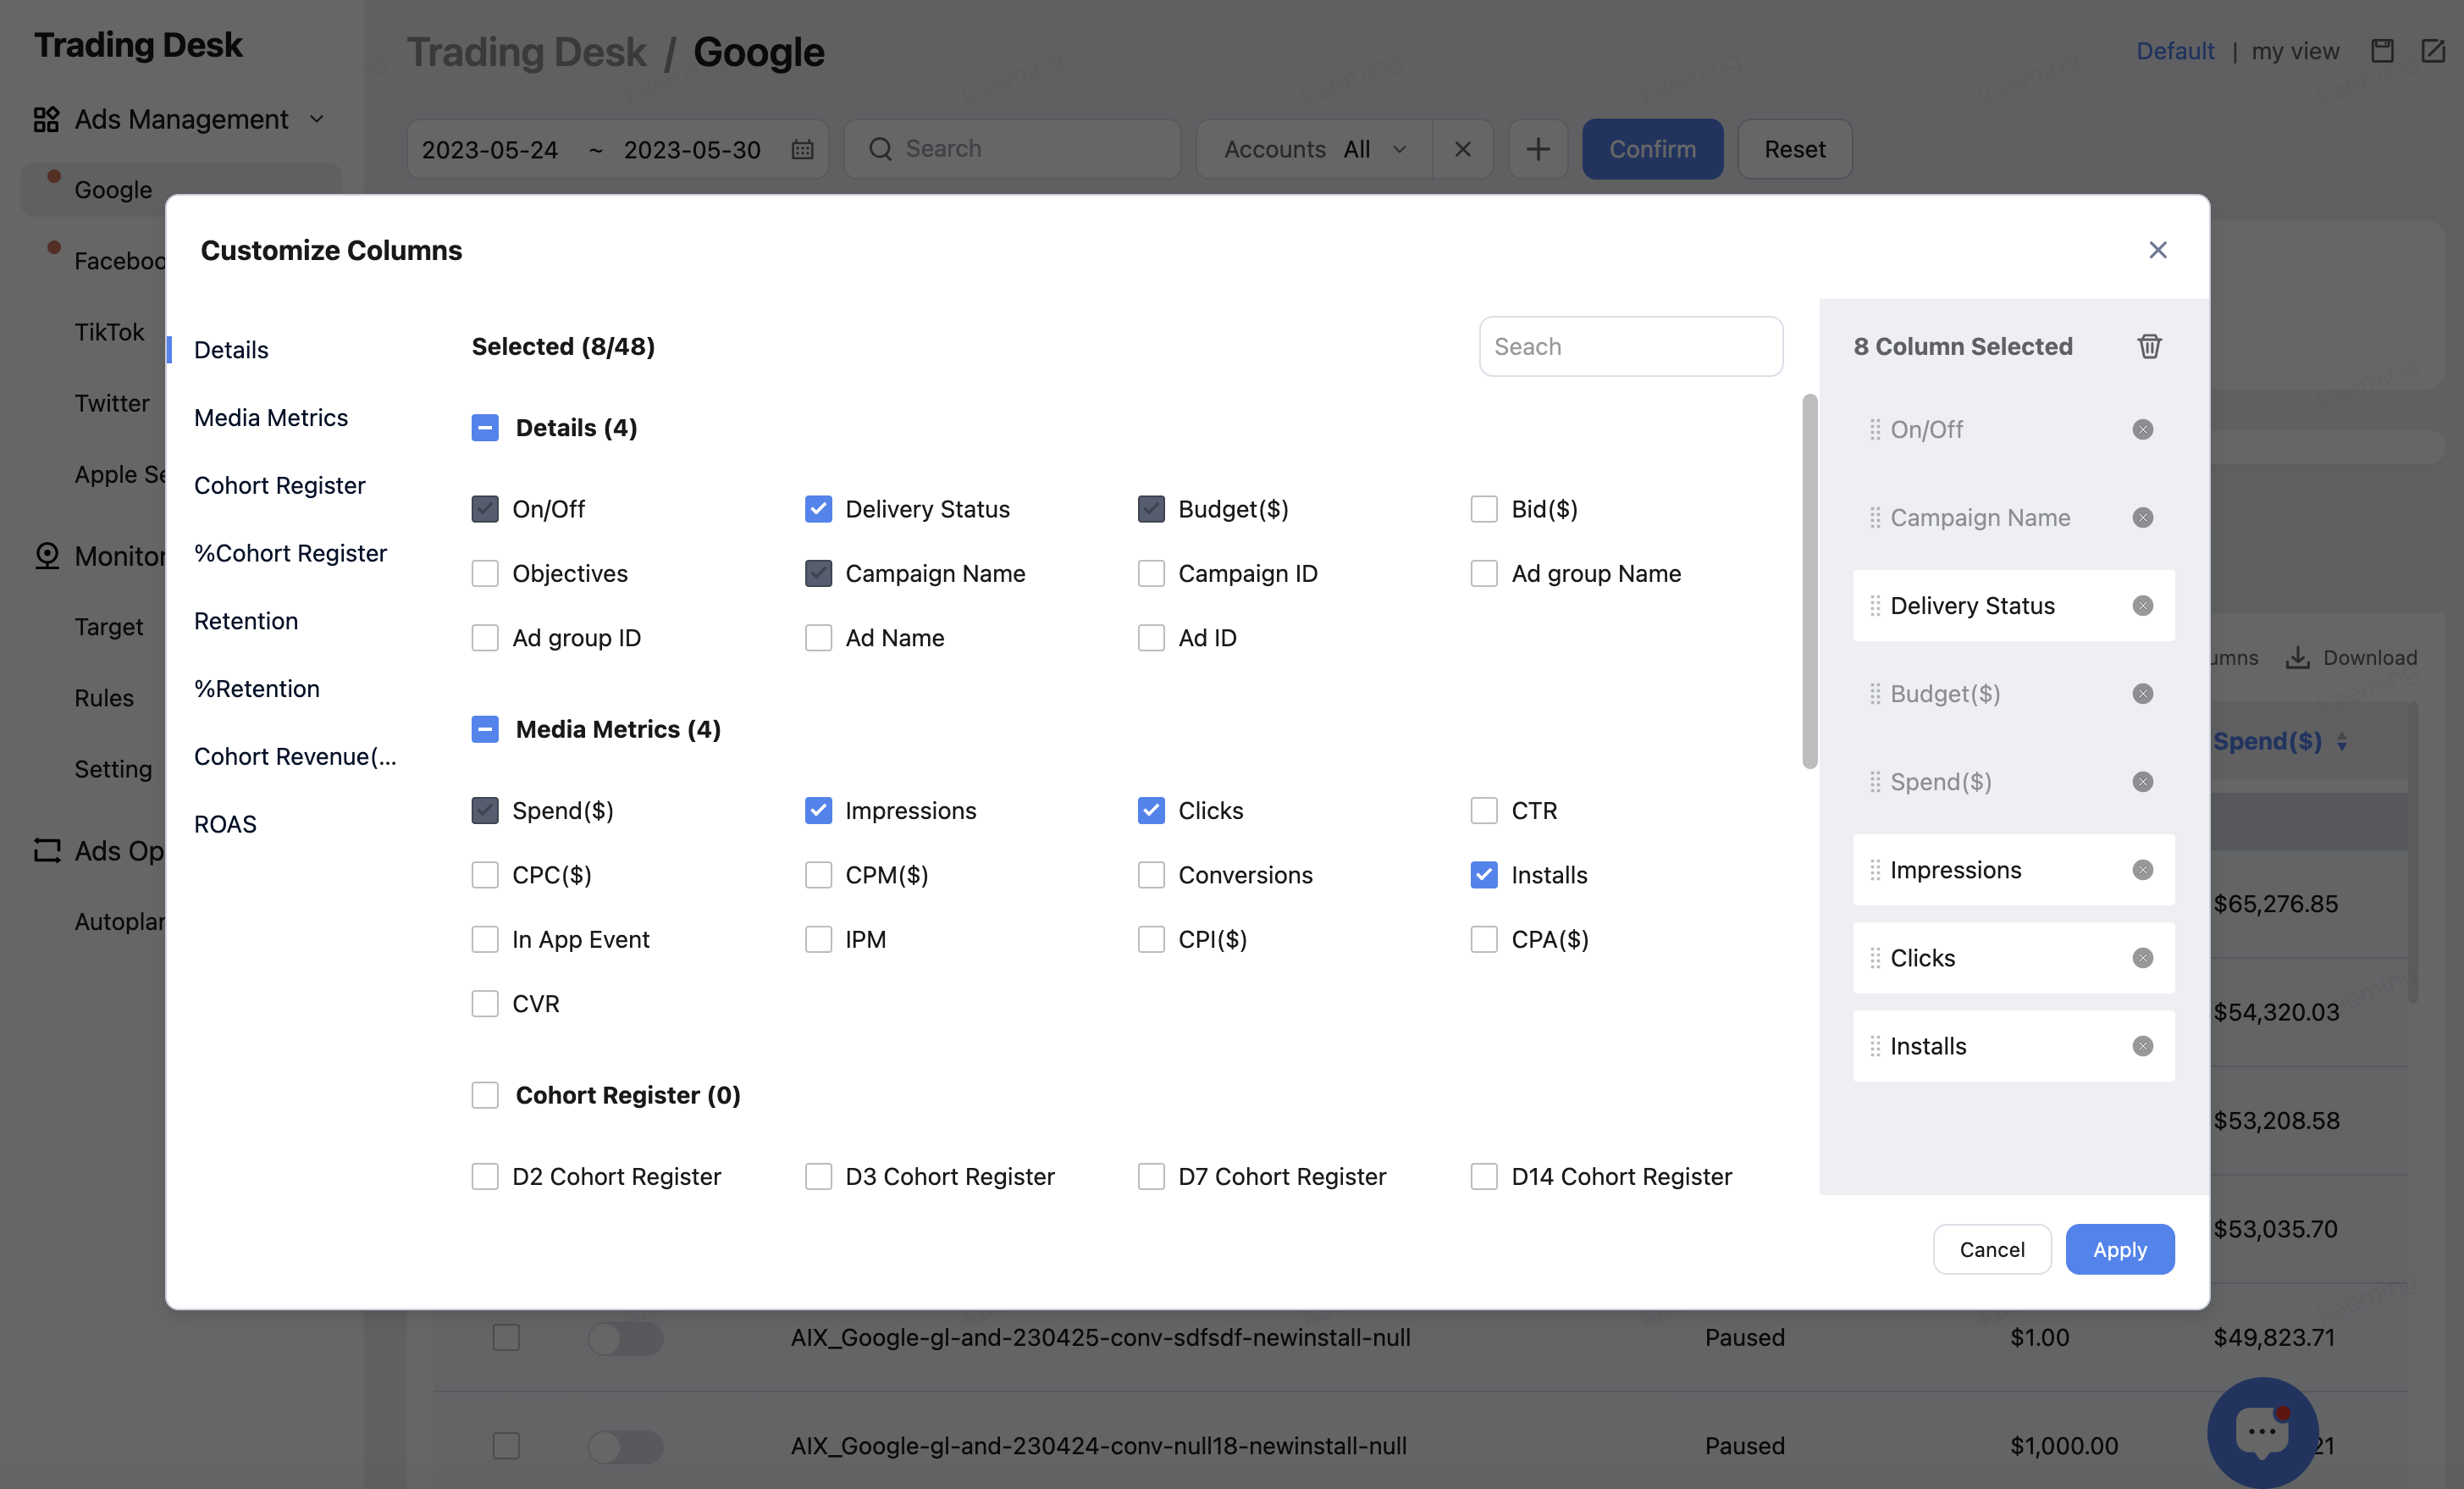
Customize Metrics
Click Columns to customize the metrics displayed in the columns.
Drag the metrics on the right panel to change the display order in the list. The first metric is the fixed column on the left of the data table.
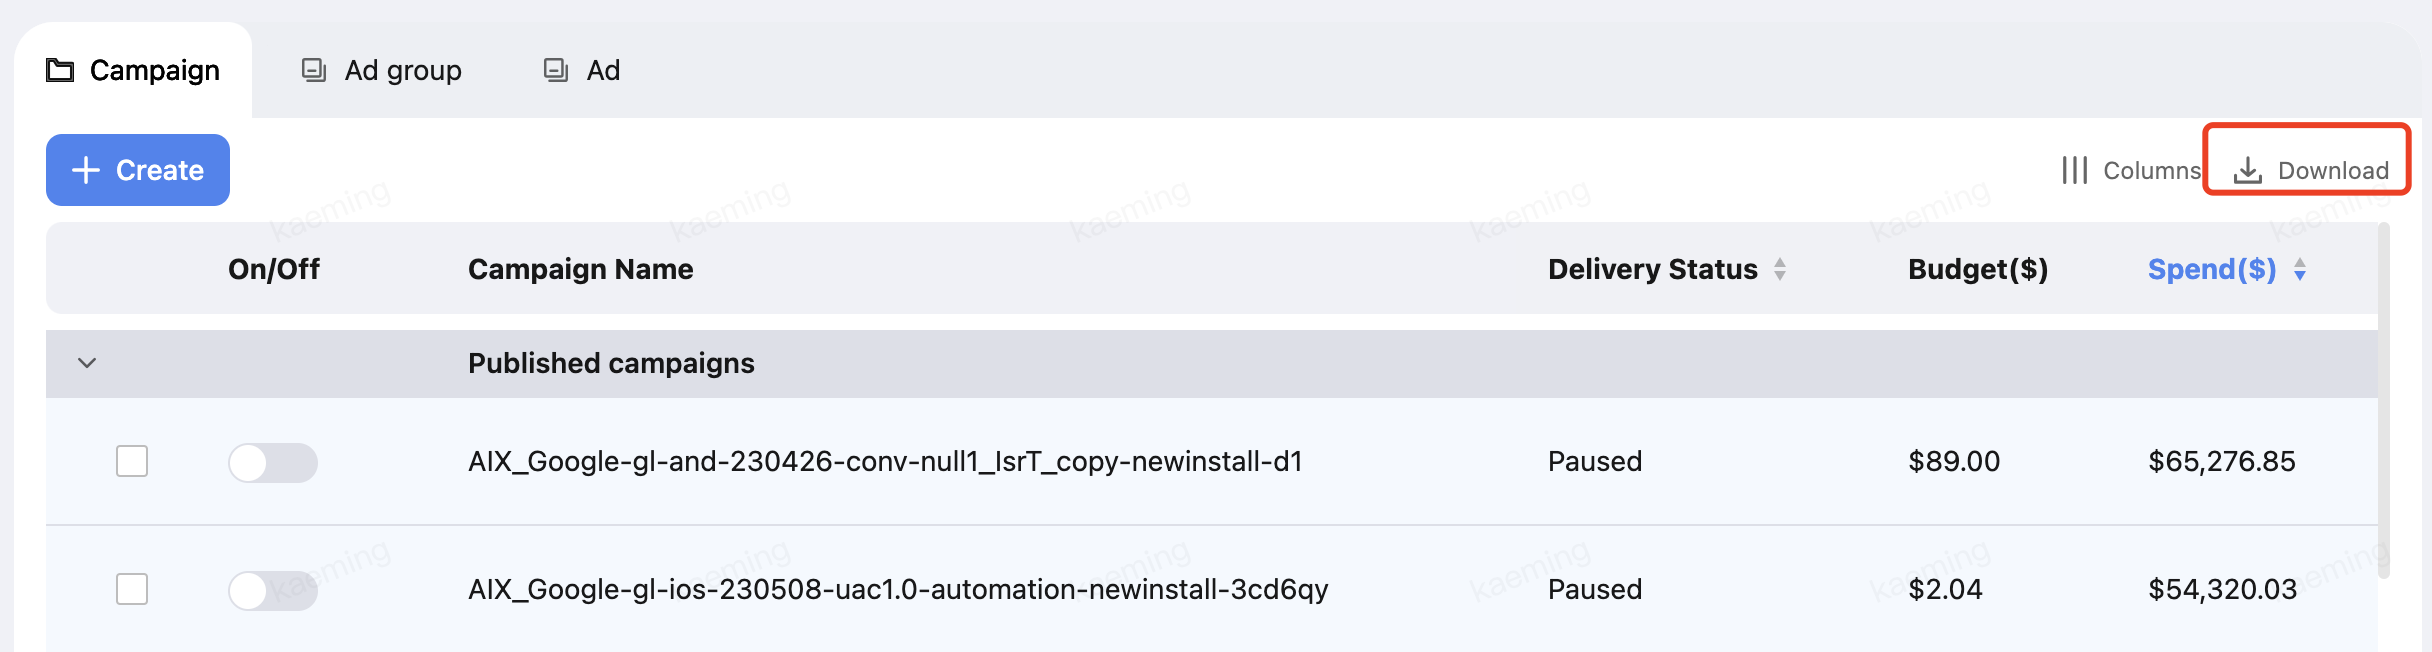
Download Data
To download data, click Download in the upper right corner.